Configuring the Dashboard
Available on all tiers:
Contents
About
The Dashboard in the TrueContext web portal allows administrators to configure dynamic reports that give basic insight into overall form submissions by form/groups of forms, by user, or by location. The Dashboard is accessed through the "Home" tab in the main menu.
Using the Dashboard
Pages
In dashboards containing multiple reports, reports can be organized into pages for easy viewing. For example, you may want to set up one page for reports showing data from the current week, while another page could host only reports showing data from the current day.
Reports
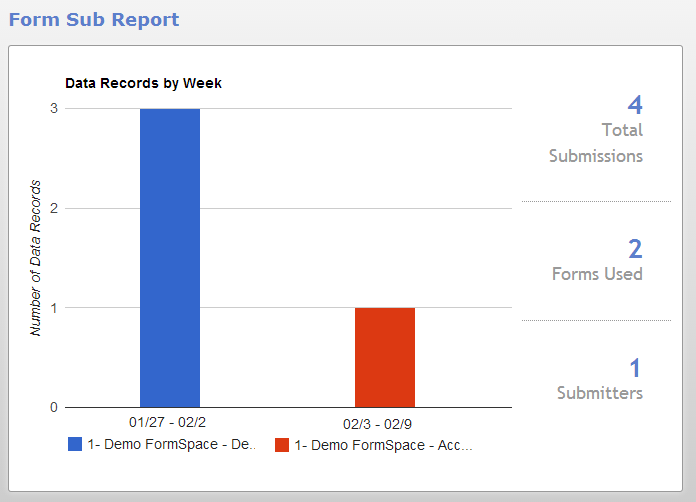
There are two types of reports available. Form Submissions reports track the number of submissions made against specified forms. User submission reports track the submissions made by specified users. Both types of reports can be customized to only show information that falls within a specified time period.
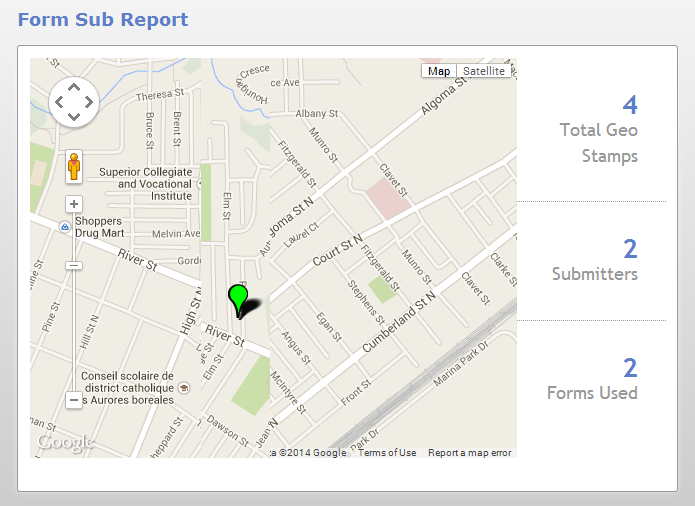
Reports can be displayed in either a chart form, or plotted on a map based on a form geo stamp![]() Geo Location refers to the capture of location data in a form. A Geo Location question can act as a selector, where the user selects a location on a map, or as a stamp, which automatically captures the device's current location when a form page opens. Location data is classified as Fine (GPS) or Coarse (Network), depending on the accuracy of the source..
Geo Location refers to the capture of location data in a form. A Geo Location question can act as a selector, where the user selects a location on a map, or as a stamp, which automatically captures the device's current location when a form page opens. Location data is classified as Fine (GPS) or Coarse (Network), depending on the accuracy of the source..
Chart |
Map |
 |
 |
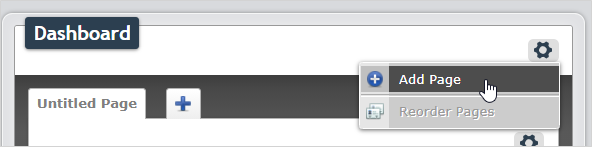
Add a Page
-
Mouse over the
 icon in the top right of the dashboard screen.
 -
Select Add Page from the dropdown list.
-
Choose a Name for the page, and select the Save button.
Add Reports
With the desired page chosen, mouse over the lower icon and select the desired report type.
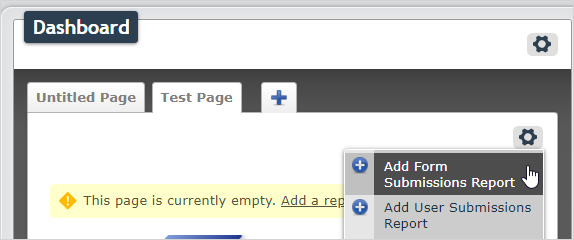
Form Submissions Reports
Report Properties
- Name
- Output Format: Chart or Map
- Time Period: The report will show Form Submission Data that falls within the chosen time period. Note that the time period chosen is relative to when the report is being viewed, not when it is created. For example, if "This Hour" is chosen as the time period, the only data visible in the report will be from forms submitted in the hour that the user is viewing the report.
Aggregation Properties
Chart:
- Show Annotations
- Show Aggregate Data
- Time Increment By: Week, Day, Day of Week, Hour
-
Workflow State: Report on records in a specific workflow state
 The workflow state describes the current stage in a workflow as a result of the last action taken on a record. For example, a record might have the workflow state "Dispatched"., or report on records in all states. Select one of the following options:
- All
- Dispatched
- Incomplete
- Pending Approval
- Changes Requested
- Reopened
- Completed
- Cancelled
Info:The topic Form Submission Workflow Status and States: Workflow state describes these options in more detail.
Map:
This output format will only collect successfully completed Data Records that have been submitted by the end user; data from incomplete forms will not be included.
- Geo Stamp Search Type: Select which Form geostamp to use to plot submissions on the map.
- All
- Data Record: Use the data record geo location Geo Location refers to the capture of location data in a form. A Geo Location question can act as a selector, where the user selects a location on a map, or as a stamp, which automatically captures the device's current location when a form page opens. Location data is classified as Fine (GPS) or Coarse (Network), depending on the accuracy of the source. automatically collected when the form is started on the mobile device.
- Geo Answer Data: Use the data collected by a Geo location control on the form; these controls collect geo location only when the page they are on is first accessed.
Linked Forms
Select the forms that will be included in the report. Move forms between the Available and Selected columns with the arrow buttons.
User Submissions Reports
Report Properties
- Name
- Output Format: Chart or Map
- Time Period: The report will show User Submission Data that falls within the chosen time period. Note that the time period chosen is relative to when the report is being viewed, not when it is created. For example, if "This Hour" is chosen as the time period, the only data visible in the report will be from forms submitted in the hour that the user is viewing the report.
Aggregation Properties
Chart:
- Show Annotations
- Show Aggregate Data
- Time Increment By: Week, Day, Day of Week, Hour
- Workflow State: Report on records in a specific workflow state, or report on records in all states. Select one of the following options:
- All
- Dispatched
- Incomplete
- Pending Approval
- Changes Requested
- Reopened
- Completed
- Cancelled
Info:The topic Form Submission Workflow Status and States: Workflow state describes these options in more detail.
Map:
This output format will only collect successfully completed Data Records that have been submitted by the end user; data from incomplete forms will not be included.
- Geo Stamp Search Type: Select which Form geostamp to use to plot submissions on the map.
- All
- Data Record: Use the data record geo location automatically collected when the form is started on the mobile device.
- Geo Answer Data: Use the data collected by a Geo location control on the form; these controls collect geo location only when the page they are on is first accessed.
Linked Users
Select the users to be included in the report. Move users between the Available and Selected columns with the arrow buttons.
Edit or Delete a Page
To Edit or Delete an existing page:
-
Select the desired page from the dashboard screen.
-
Mouse over the lower
icon and select Edit Page or Delete Page.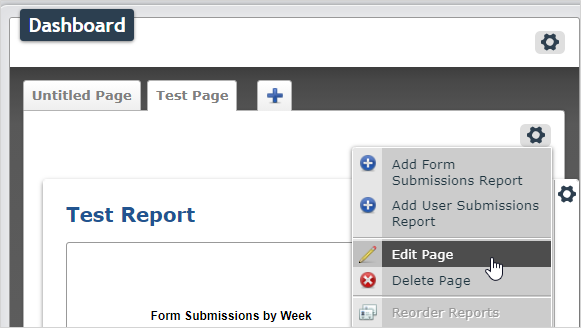
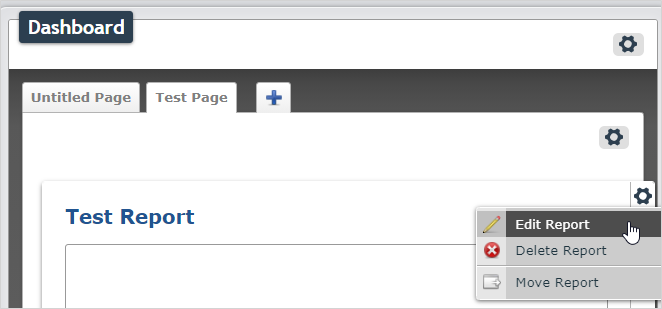
Edit, Delete or Move Reports
To Edit, Delete, or Move an existing report:
-
Select the page that the report is on.
-
Scroll down to the report, and mouse over the
icon on the right. -
Select Edit, Delete, or Move Report.